Click here to launch the World Rivers visualization
For quite a while I have been fascinated by maps that show the underlying structure of a geography without directly describing it. Maps like All Streets. Animated maps like the wind map. I decided to try out this form of visualization using all the waters of the world: the oceans, lakes, glaciers, and rivers. Could viewers see a passable human globe, recognize continents and important areas of the world?
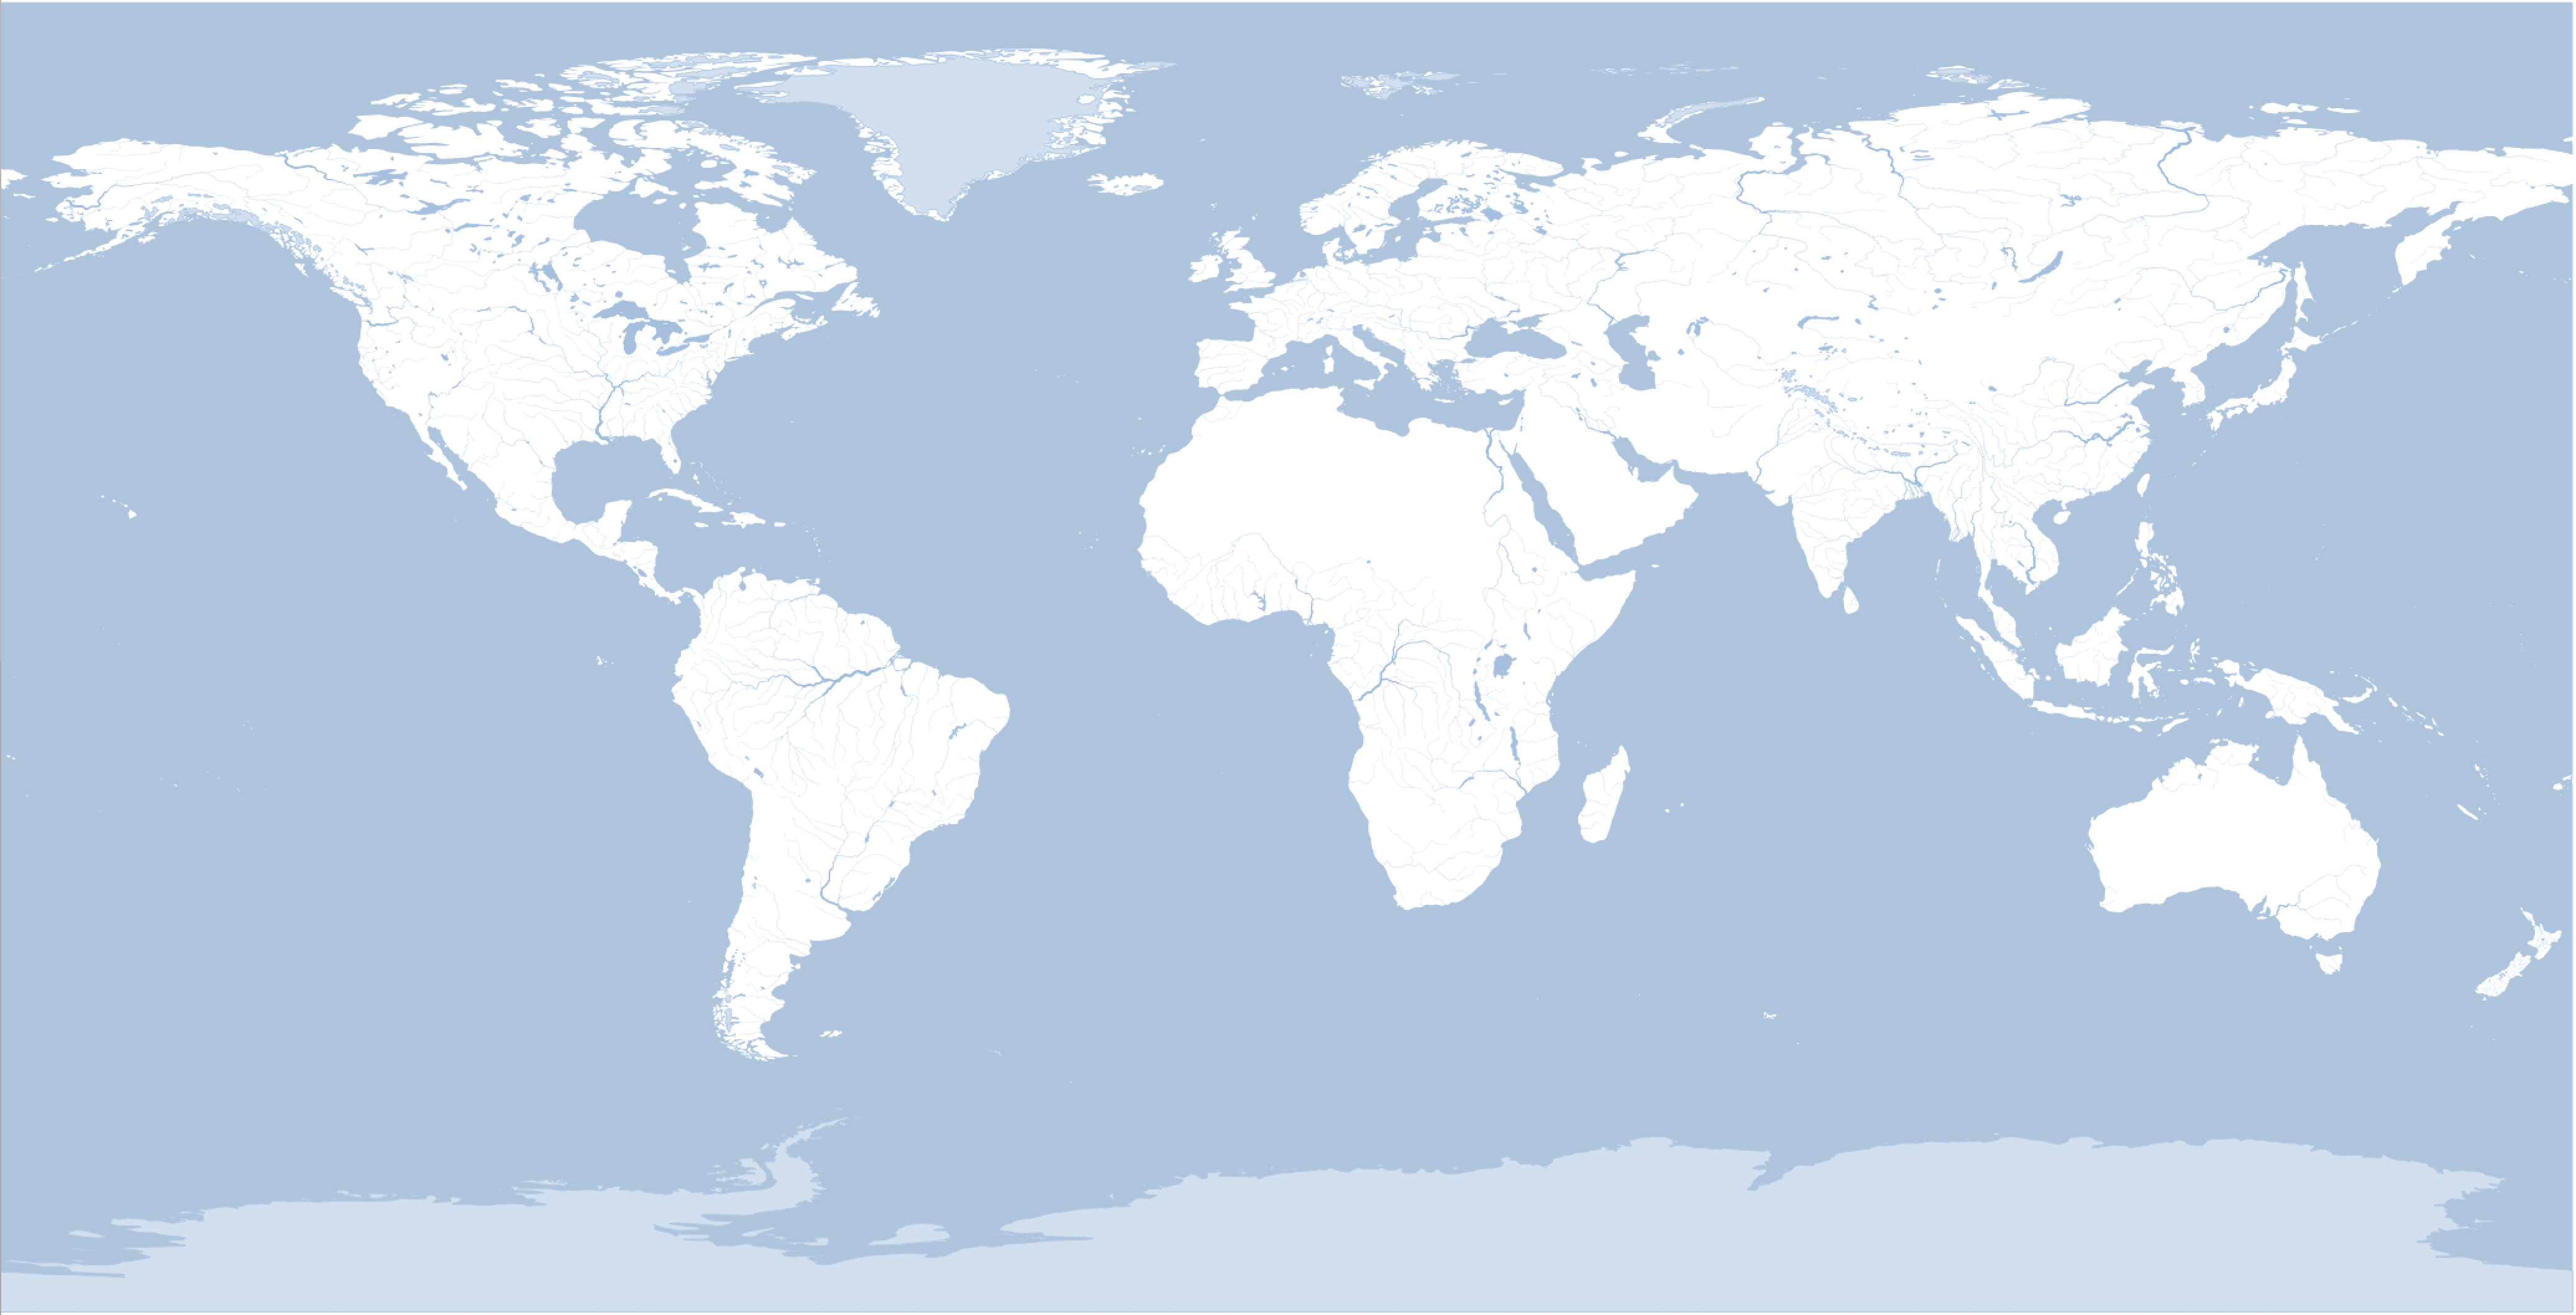
I started with data from Natural Earth Data, and created a straight forward map of all the water on the globe. Then I tried a simple globe:
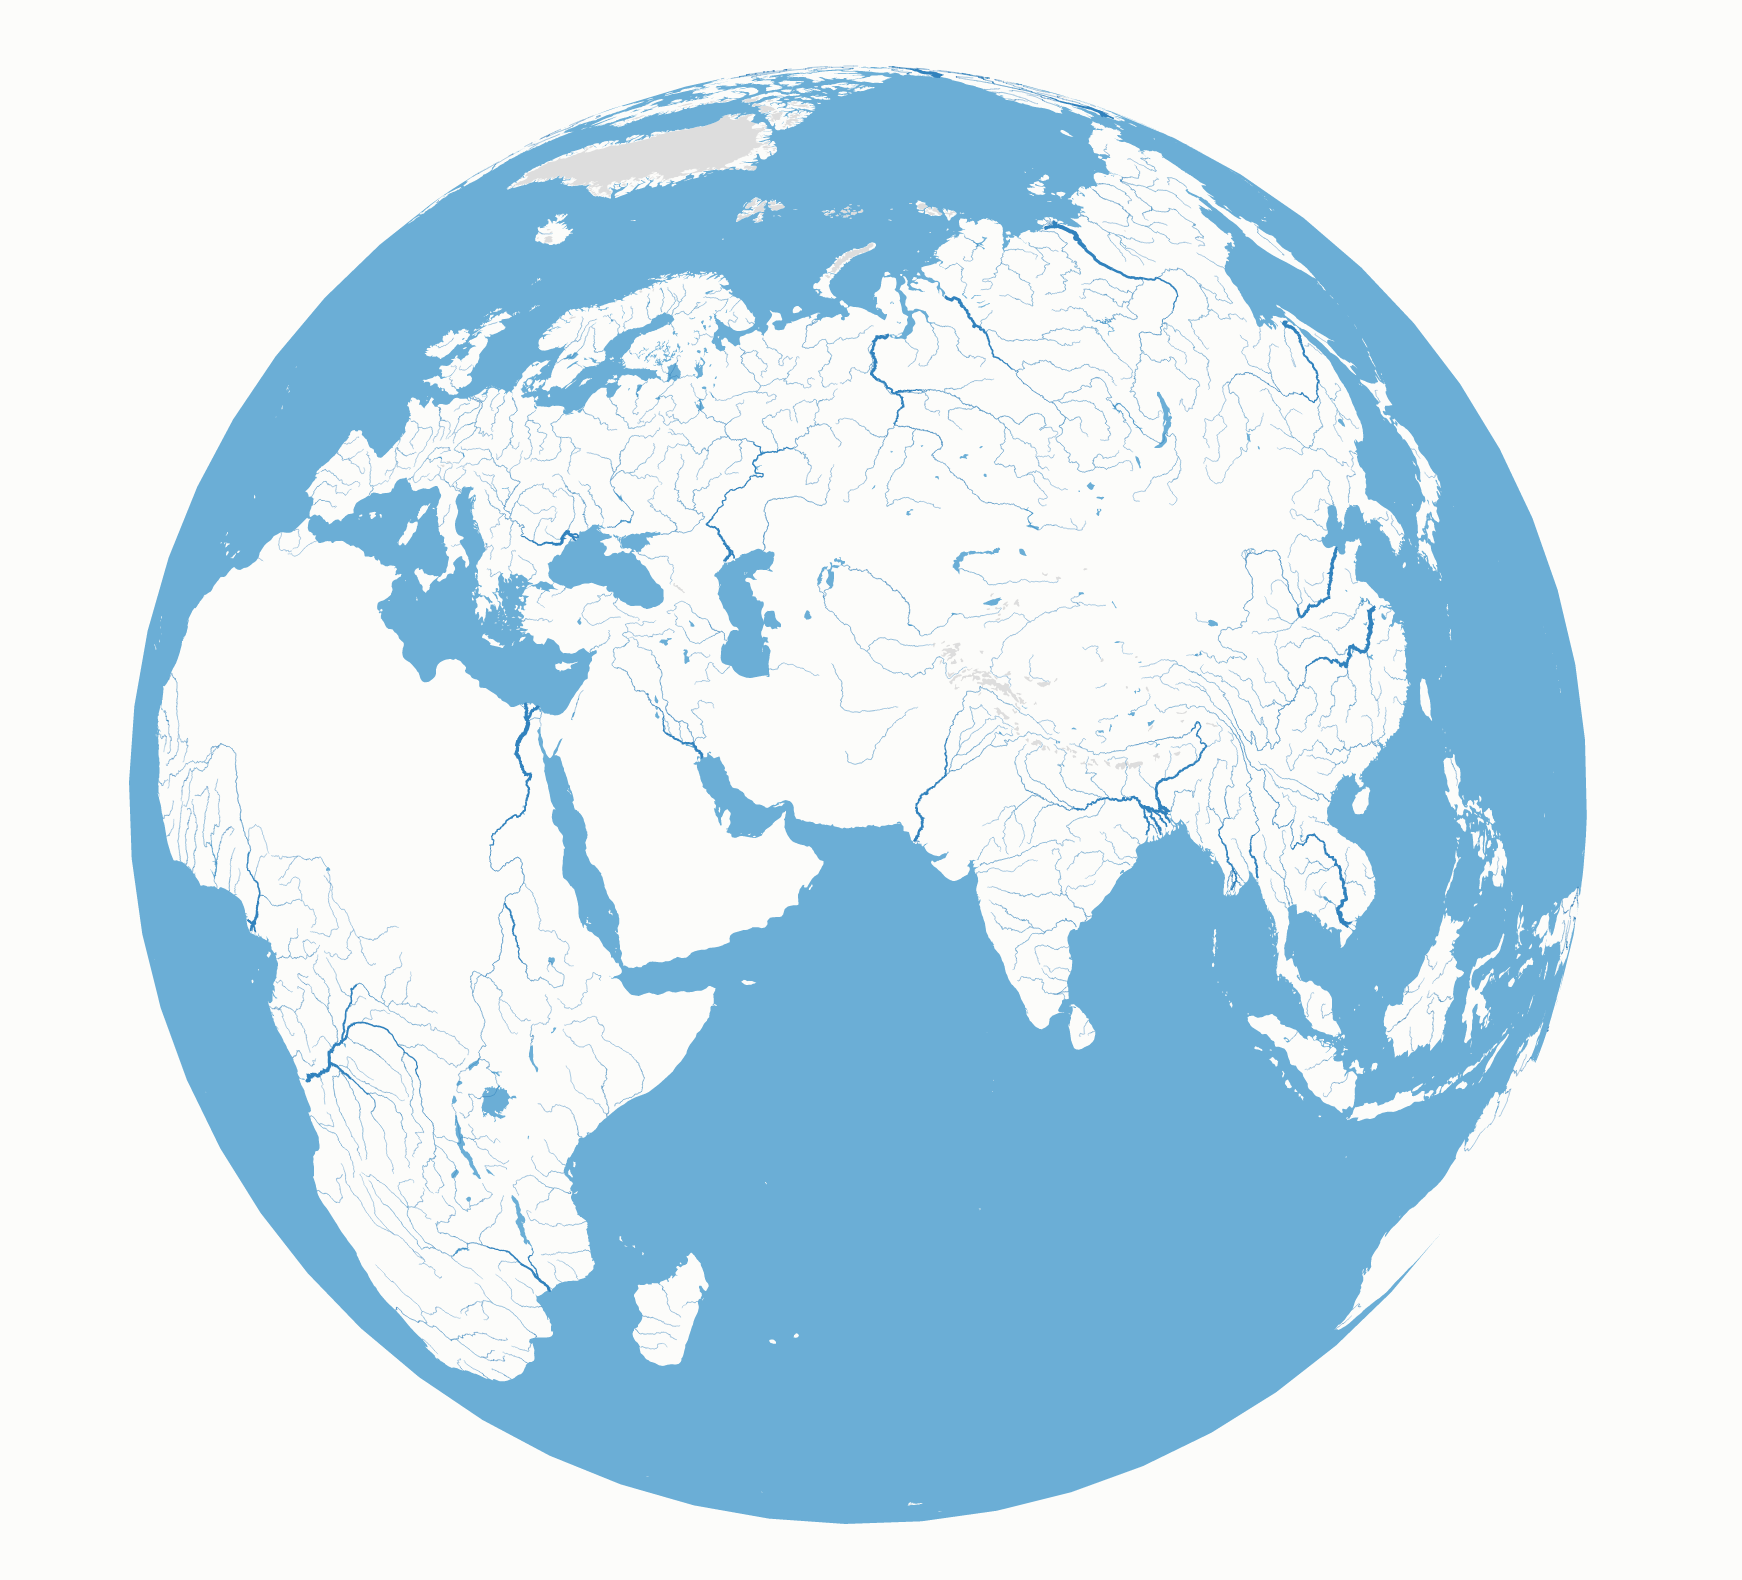
Once I got a reasonable round rendering using a combination of topojson and d3, I decided to make the map interactive. I thought, d3 can do anything! I’ll make an spinning globe!
I quickly came to the realization that d3 might be able to do “anything”, but, how quickly? Animating a data visualization built on SVG is one thing, and rendering all rivers, lakes, and oceans mapped onto a sphere, and then animating (or, repeating the same render forever!) is altogether different. Needless to say, my animated globe chugged along painfully slow: seconds ticked by, and you could see the rivers as they were splatted onto the globe.
Clearly SVG was not the right tool for the job. To overcome the speed problem, I decided to use a combination of d3 and threeJS. D3 would render my basemap and rivers on an HTML canvas one time. Then ThreeJS would take that canvas and wrap it around a sphere, and animate it.
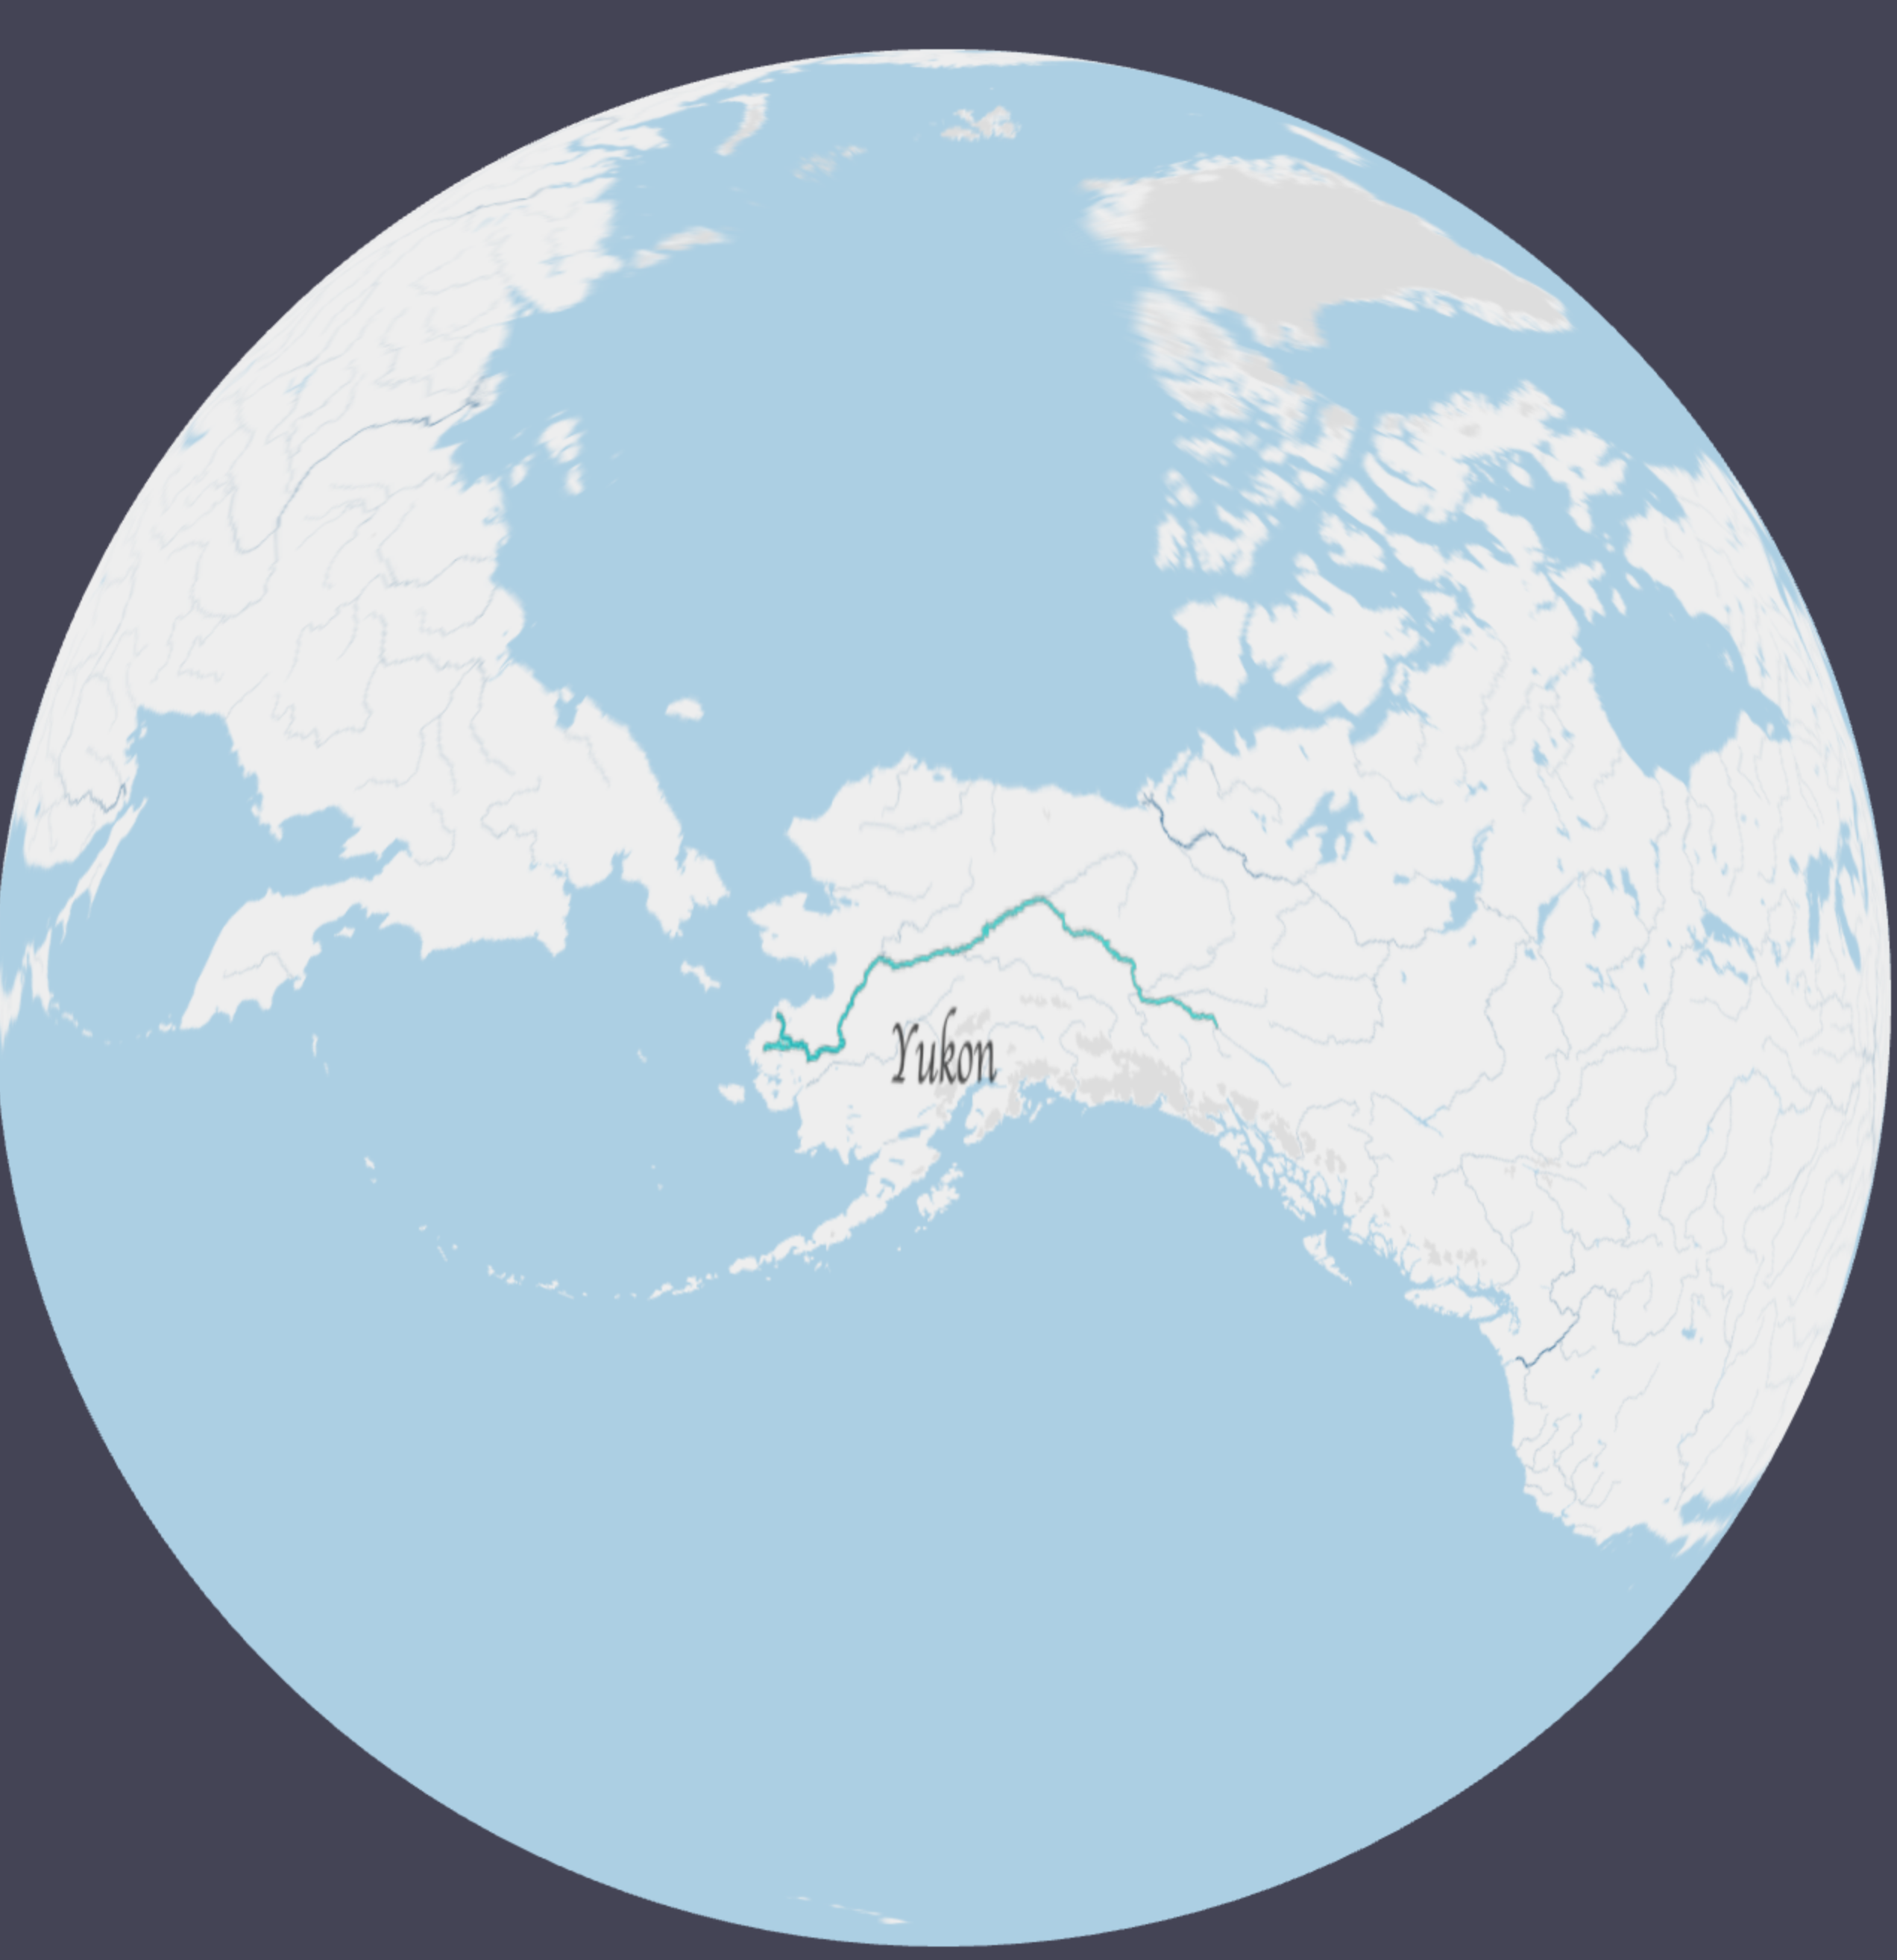
Then I thought, wouldn’t it be nice to allow the user to control the globe? Spin it around themselves, click on lakes and rivers…like an interactive screen saver.
To add this interactivity, I built more logic on top of my rotating globe: mouse clicks would be converted from the XY of the page’s coordinate system to that on the sphere, then translated to latitude and longitude. By constructing a Voronoi diagram of a sampled set of points for all rivers I could determine which river the user had clicked on.
I used D3 to re-render the selected river with a ‘highlight’ style, which is then overlaid above the globe.
Finally, to keep things ‘active’ I added an idleness routine: whenever the user hasn’t interacted with the visualization for a while, a river is randomly selected, and the globe rotates it into focus.